
Grafana Agent
Platform:
| Channel | Revision | Published | Runs on |
|---|---|---|---|
| 0.44/stable | 824 | 07 Jul 2026 | |
| 0.44/stable | 831 | 07 Jul 2026 | |
| 0.44/stable | 816 | 07 Jul 2026 | |
| 0.44/stable | 828 | 07 Jul 2026 | |
| 0.44/stable | 829 | 07 Jul 2026 | |
| 0.44/stable | 833 | 07 Jul 2026 | |
| 0.44/stable | 832 | 07 Jul 2026 | |
| 0.44/stable | 827 | 07 Jul 2026 | |
| 0.44/stable | 830 | 07 Jul 2026 | |
| 0.44/stable | 825 | 07 Jul 2026 | |
| 0.44/stable | 826 | 07 Jul 2026 | |
| 0.44/candidate | 824 | 07 Jul 2026 | |
| 0.44/candidate | 831 | 07 Jul 2026 | |
| 0.44/candidate | 816 | 07 Jul 2026 | |
| 0.44/candidate | 828 | 07 Jul 2026 | |
| 0.44/candidate | 829 | 07 Jul 2026 | |
| 0.44/candidate | 833 | 07 Jul 2026 | |
| 0.44/candidate | 832 | 07 Jul 2026 | |
| 0.44/candidate | 827 | 07 Jul 2026 | |
| 0.44/candidate | 830 | 07 Jul 2026 | |
| 0.44/candidate | 825 | 07 Jul 2026 | |
| 0.44/candidate | 826 | 07 Jul 2026 | |
| 0.44/beta | 824 | 07 Jul 2026 | |
| 0.44/beta | 831 | 07 Jul 2026 | |
| 0.44/beta | 816 | 07 Jul 2026 | |
| 0.44/beta | 828 | 07 Jul 2026 | |
| 0.44/beta | 829 | 07 Jul 2026 | |
| 0.44/beta | 833 | 07 Jul 2026 | |
| 0.44/beta | 832 | 07 Jul 2026 | |
| 0.44/beta | 827 | 07 Jul 2026 | |
| 0.44/beta | 830 | 07 Jul 2026 | |
| 0.44/beta | 825 | 07 Jul 2026 | |
| 0.44/beta | 826 | 07 Jul 2026 | |
| 0.44/edge | 833 | 07 Jul 2026 | |
| 0.44/edge | 832 | 07 Jul 2026 | |
| 0.44/edge | 831 | 07 Jul 2026 | |
| 0.44/edge | 830 | 07 Jul 2026 | |
| 0.44/edge | 829 | 07 Jul 2026 | |
| 0.44/edge | 828 | 07 Jul 2026 | |
| 0.44/edge | 827 | 07 Jul 2026 | |
| 0.44/edge | 826 | 07 Jul 2026 | |
| 0.44/edge | 825 | 07 Jul 2026 | |
| 0.44/edge | 824 | 07 Jul 2026 | |
| 0.44/edge | 816 | 07 Jul 2026 | |
| dev/edge | 858 | 14 Jul 2026 | |
| dev/edge | 857 | 14 Jul 2026 | |
| dev/edge | 856 | 14 Jul 2026 | |
| dev/edge | 855 | 14 Jul 2026 | |
| dev/edge | 854 | 13 Jul 2026 | |
| dev/edge | 853 | 13 Jul 2026 | |
| dev/edge | 852 | 13 Jul 2026 | |
| dev/edge | 832 | 25 Feb 2026 | |
| dev/edge | 826 | 25 Feb 2026 | |
| dev/edge | 825 | 25 Feb 2026 | |
| dev/edge | 816 | 25 Feb 2026 | |
| 2/stable | 851 | 07 Jul 2026 | |
| 2/stable | 846 | 07 Jul 2026 | |
| 2/stable | 850 | 07 Jul 2026 | |
| 2/stable | 849 | 07 Jul 2026 | |
| 2/stable | 848 | 07 Jul 2026 | |
| 2/stable | 847 | 07 Jul 2026 | |
| 2/candidate | 851 | 18 Jun 2026 | |
| 2/candidate | 846 | 18 Jun 2026 | |
| 2/candidate | 850 | 18 Jun 2026 | |
| 2/candidate | 849 | 18 Jun 2026 | |
| 2/candidate | 848 | 18 Jun 2026 | |
| 2/candidate | 847 | 18 Jun 2026 | |
| 2/beta | 851 | 18 Jun 2026 | |
| 2/beta | 846 | 18 Jun 2026 | |
| 2/beta | 850 | 18 Jun 2026 | |
| 2/beta | 849 | 18 Jun 2026 | |
| 2/beta | 848 | 18 Jun 2026 | |
| 2/beta | 847 | 18 Jun 2026 | |
| 2/edge | 851 | 17 Jun 2026 | |
| 2/edge | 850 | 17 Jun 2026 | |
| 2/edge | 849 | 17 Jun 2026 | |
| 2/edge | 848 | 17 Jun 2026 | |
| 2/edge | 847 | 17 Jun 2026 | |
| 2/edge | 846 | 17 Jun 2026 | |
| 1/stable | 606 | 18 Sep 2025 | |
| 1/stable | 605 | 18 Sep 2025 | |
| 1/stable | 607 | 18 Sep 2025 | |
| 1/stable | 603 | 18 Sep 2025 | |
| 1/stable | 604 | 18 Sep 2025 | |
| 1/stable | 602 | 18 Sep 2025 | |
| 1/candidate | 606 | 09 Sep 2025 | |
| 1/candidate | 605 | 09 Sep 2025 | |
| 1/candidate | 607 | 09 Sep 2025 | |
| 1/candidate | 603 | 09 Sep 2025 | |
| 1/candidate | 604 | 09 Sep 2025 | |
| 1/candidate | 602 | 09 Sep 2025 | |
| 1/beta | 606 | 02 Sep 2025 | |
| 1/beta | 605 | 02 Sep 2025 | |
| 1/beta | 607 | 02 Sep 2025 | |
| 1/beta | 603 | 02 Sep 2025 | |
| 1/beta | 604 | 02 Sep 2025 | |
| 1/beta | 602 | 02 Sep 2025 | |
| 1/edge | 607 | 20 Aug 2025 | |
| 1/edge | 606 | 20 Aug 2025 | |
| 1/edge | 605 | 20 Aug 2025 | |
| 1/edge | 604 | 20 Aug 2025 | |
| 1/edge | 603 | 20 Aug 2025 | |
| 1/edge | 602 | 20 Aug 2025 |
juju deploy grafana-agent --channel 0.44/stableAll metrics are missing
Inspect the /agent/api/v1/metrics/targets endpoint, for example:
juju ssh grafana-agent/0 curl localhost:12345/agent/api/v1/metrics/targets
Look for entries such as
      "state": "down",
      "last_scrape": "2025-06-09T16:25:49.440292064Z",
      "scrape_duration_ms": 0,
      "scrape_error": "Get \"http://localhost:8081/metrics\": dial tcp 127.0.0.1:8081: connect: connection refused"
Make sure:
- Your scrape target is listed.
- Address any errors in
scrape_error.
Scrape error: connect: connection refused
A scrape will fail with connect: connection refused when:
- The scrape target is listening on a particular interface (e.g. 127.0.0.1), but the scrape request is coming from somewhere else. The workload should be configured to bind to the correct interface, or to 0.0.0.0 (all interfaces).
"connection reset by peer" and "499 Client Closed Request" errors
Deployment example
Let’s imagine a Grafana Agent charm scrapes an application, and forward their logs to a Prometheus instances in another model.
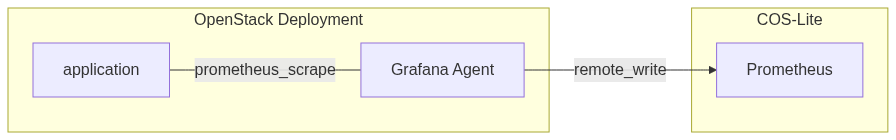
Signs that something is wrong
In such a deployment, we expect OpenStack metrics to be sent regularly to Prometheus through Grafana Agent, but that doesn’t happen.
If we do some research we may find this kind of error logs in grafana-agent:
Jul 19 12:39:05 scexporter01 grafana-agent.grafana-agent[724]: ts=2024-07-19T12:39:05.965934155Z caller=dedupe.go:112 agent=prometheus instance=605713fb3bd3f34da68dbf90216eef44 component=remote level=warn remote_name=605713-e27a59 url=http://172.16.14.11/cos-prometheus-0/api/v1/write msg="Failed to send batch, retrying" err="Post \"http://172.16.14.11/cos-prometheus-0/api/v1/write\": read tcp 172.16.14.99:39972->172.16.14.11:80: read: connection reset by peer"
The most important part of this log line is: read: connection reset by peer. What this is telling us is that Prometheus is closing the connection grafana-agent is trying to establish.
Since in our deployment Traefik is the ingress for Prometheus, we can confirm this by checking the its logs:
2024-07-22T17:47:10.811Z [traefik] time="2024-07-22T17:47:10Z" level=debug msg="'499 Client Closed Request' caused by: context canceled"
We may think the problem can be somewhere in the connection between Grafana Agent and Prometheus, but in this situation the real problem is in the other end.
Scrape Timeouts
If the application that Grafana Agent is scrapes takes a long time to return its metrics endpoint, in particular a longer time than the default timeout configured in Grafana Agent, we will start to see these types of errors because sends an empty request to Prometheus.
We can verify the response times by running:
$ time curl http://APPLICATION_ADDRESS:PORT/metrics
and we will obtain a bunch of metrics and the response time:
...
# TYPE ring_member_tokens_to_own gauge
ring_member_tokens_to_own{name="compactor"} 1
ring_member_tokens_to_own{name="scheduler"} 1
curl http://APPLICATION_ADDRESS:PORT/metrics 0,01s user 0,01s system 0% cpu 12,064 total
Note that in this example, the response time is more than 12s and our default global_scrape_timeout in Grafana Agent is 10s.
How to solve this situation
As we could see the problem is the response time of the metrics endpoint Grafana Agent scrapes. We need to figure out the root cause of such delay.
If we are not able to reduce the response times of our metrics endpoint we can increase the global_scrape_timeout in Grafana agent charm by running:
juju config grafana-agent global_scrape_timeout="15s"