
Prometheus Pushgateway Charmed Operator
- By Simon Aronsson
| Channel | Revision | Published | Runs on |
|---|---|---|---|
| latest/stable | 9 | 24 Apr 2024 | |
| latest/candidate | 9 | 26 Mar 2024 | |
| latest/beta | 12 | 24 Apr 2024 | |
| latest/edge | 16 | 03 May 2024 |
juju deploy prometheus-pushgateway-k8s --channel candidate
Deploy Kubernetes operators easily with Juju, the Universal Operator Lifecycle Manager. Need a Kubernetes cluster? Install MicroK8s to create a full CNCF-certified Kubernetes system in under 60 seconds.
Platform:
Table of Contents
- Preview
- Prometheus Pushgateway charmed operator for K8s
- 1. Send metrics to Prometheus through Prometheus Pushgateway
-
2. Send metrics over
HTTPSto Prometheus through Prometheus Pushgateway
Preview
Initial situation
Let’s imagine we have jobs such as a service-level batch (for instance, a batch job that deletes a number of users for an entire service) and need to capture the outcome (which is ephemeral) to send its metrics to Prometheus.
How would we do that?: The answer is quite straight forward: Prometheus Pushgateway.
What if we are in a Juju-driven Kubernetes environment?: The answer is even more straight forward: Promethes Pushgateway charmed operator
Prometheus Pushgateway charmed operator for K8s
The Prometheus Pushgateway charmed operator handles installation, configuration, and Day 2 operations specific to Pushgateway, using Juju and the Charmed Operator Lifecycle Manager (OLM).
1. Send metrics to Prometheus through Prometheus Pushgateway
There are two ways to send metrics to Prometheus through Pushgateway.
A. Using send_metric library method
The requirer side of the Prometheus Pushgateway library provides a send_metric() method so it is possible to easily instrument an action in a my-charm to send metrics.
Let’s say we have the following charms and relations:
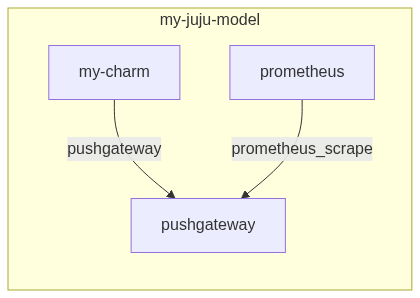
$ juju status --relations
Model          Controller  Cloud/Region        Version  SLA          Timestamp
my-juju-model  microk8s    microk8s/localhost  3.1.5    unsupported  16:01:42-03:00

App          Version  Status  Scale  Charm                       Channel  Rev  Address         Exposed  Message
my-charm              active      1  testingcharm                           1  10.152.183.234  no
prometheus   2.46.0   active      1  prometheus-k8s              edge     149  10.152.183.174  no
pushgateway  1.6.1    active      1  prometheus-pushgateway-k8s             0  10.152.183.191  no

Unit            Workload  Agent  Address     Ports  Message
my-charm/0*     active    idle   10.1.38.75
prometheus/0*   active    idle   10.1.38.81
pushgateway/0*  active    idle   10.1.38.97

Relation provider              Requirer                       Interface          Type     Message
prometheus:prometheus-peers    prometheus:prometheus-peers    prometheus_peers   peer
pushgateway:metrics-endpoint   prometheus:metrics-endpoint    prometheus_scrape  regular
pushgateway:push-endpoint      my-charm:pushgateway           pushgateway        regular
pushgateway:pushgateway-peers  pushgateway:pushgateway-peers  pushgateway_peers  peer
Then my-charm let us send metrics to prometheus through pushgateway this way:
$ juju run my-charm/0 send-metric --string-args name="messi_goals" value="819"
Running operation 3 with 1 task
  - task 4 on unit-my-charm-0

Waiting for task 4...
ok: "True"
Once prometheus scrapes pushgateway we can check the metric we have sent it is stored by performing a HTTP request to prometheus:
$ curl -s http://10.1.38.81:9090/api/v1/query\?query="messi_goals" | jq
{
  "status": "success",
  "data": {
    "resultType": "vector",
    "result": [
      {
        "metric": {
          "__name__": "messi_goals",
          "job": "default",
          "juju_application": "pushgateway",
          "juju_charm": "prometheus-pushgateway-k8s",
          "juju_model": "my-juju-model",
          "juju_model_uuid": "ef7d8019-ed21-4cdd-875b-c2501a51c34f"
        },
        "value": [
          1695746698.353,
          "819"
        ]
      }
    ]
  }
}
B. Using regular HTTP request
The second alternative to send metrics to Prometheus through Pushgateway is by performing a regular HTTP request.
Let’s say we have a Juju model in which prometheus and pushgateway charms are running and related through the prometheus_scrape interface. Outside that Juju model let’s imagine we have a batch job that produces an output in which are metrics we need to send to Prometheus.
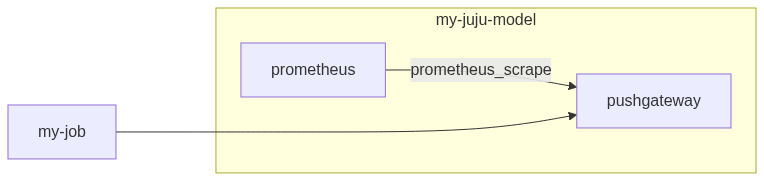
$ juju status --relations

Model          Controller  Cloud/Region        Version  SLA          Timestamp
my-juju-model  microk8s    microk8s/localhost  3.1.5    unsupported  16:02:48-03:00

App          Version  Status  Scale  Charm                       Channel  Rev  Address         Exposed  Message
prometheus   2.46.0   active      1  prometheus-k8s              edge     149  10.152.183.174  no
pushgateway  1.6.1    active      1  prometheus-pushgateway-k8s             0  10.152.183.191  no

Unit            Workload  Agent  Address     Ports  Message
prometheus/0*   active    idle   10.1.38.81
pushgateway/0*  active    idle   10.1.38.97

Relation provider              Requirer                       Interface          Type     Message
prometheus:prometheus-peers    prometheus:prometheus-peers    prometheus_peers   peer
pushgateway:metrics-endpoint   prometheus:metrics-endpoint    prometheus_scrape  regular
pushgateway:pushgateway-peers  pushgateway:pushgateway-peers  pushgateway_peers  peer
With a simple bash oneliner we are able perform a HTTP request to send metrics:
$ echo "messi_world_cups 1" | curl --data-binary @- http://10.1.38.97:9091/metrics/job/my_batch_job
Once prometheus scrapes pushgateway we can check the metric we have sent it is stored by performing a HTTP request to prometheus:
$ curl -s http://10.1.38.81:9090/api/v1/query\?query="messi_world_cups" | jq
{
  "status": "success",
  "data": {
    "resultType": "vector",
    "result": [
      {
        "metric": {
          "__name__": "messi_world_cups",
          "job": "my_batch_job",
          "juju_application": "pushgateway",
          "juju_charm": "prometheus-pushgateway-k8s",
          "juju_model": "my-juju-model",
          "juju_model_uuid": "ef7d8019-ed21-4cdd-875b-c2501a51c34f"
        },
        "value": [
          1695755237.481,
          "1"
        ]
      }
    ]
  }
}
2. Send metrics over HTTPS to Prometheus through Prometheus Pushgateway
In the previous section we have explained two alternatives to send metrics to Prometheus through Pushgateway, but both are done usign non-encrypted connections. Now it is time to improve both alternatives by using an encrypted connection.
In order to achive this, we need a Certificate Authority charm to provide certificates.
A. Using send_metric library method
Based on what we have explained in section 1.A let’s say we have added an extra charm ca (self-signed-certificates) with the following charms and relations:

$ juju status --relations

Model          Controller  Cloud/Region        Version  SLA          Timestamp
my-juju-model  microk8s    microk8s/localhost  3.1.5    unsupported  16:45:30-03:00

App          Version  Status  Scale  Charm                       Channel  Rev  Address         Exposed  Message
ca                    active      1  self-signed-certificates    edge      36  10.152.183.71   no
my-charm              active      1  testingcharm                           2  10.152.183.97   no
prometheus   2.46.0   active      1  prometheus-k8s              edge     149  10.152.183.174  no
pushgateway  1.6.1    active      1  prometheus-pushgateway-k8s             0  10.152.183.191  no

Unit            Workload  Agent  Address     Ports  Message
ca/0*           active    idle   10.1.38.94
my-charm/0*     active    idle   10.1.38.90
prometheus/0*   active    idle   10.1.38.81
pushgateway/0*  active    idle   10.1.38.97

Relation provider              Requirer                       Interface          Type     Message
ca:certificates                prometheus:certificates        tls-certificates   regular
ca:certificates                pushgateway:certificates       tls-certificates   regular
prometheus:prometheus-peers    prometheus:prometheus-peers    prometheus_peers   peer
pushgateway:metrics-endpoint   prometheus:metrics-endpoint    prometheus_scrape  regular
pushgateway:push-endpoint      my-charm:pushgateway           pushgateway        regular
pushgateway:pushgateway-peers  pushgateway:pushgateway-peers  pushgateway_peers  peer
Then my-charm let us send metrics to prometheus through pushgateway this way:
$ juju run my-charm/0 send-metric --string-args name="maradona_height" value="165"
Running operation 7 with 1 task
  - task 8 on unit-my-charm-0

Waiting for task 8...
ok: "True"
Once prometheus scrapes pushgateway we can check the metric we have sent it is stored by performing a HTTP request to prometheus:
$ curl -sk https://10.1.38.81:9090/api/v1/query\?query="maradona_world_cups" | jq
{
  "status": "success",
  "data": {
    "resultType": "vector",
    "result": [
      {
        "metric": {
          "__name__": "maradona_height",
          "job": "default",
          "juju_application": "pushgateway",
          "juju_charm": "prometheus-pushgateway-k8s",
          "juju_model": "my-juju-model",
          "juju_model_uuid": "ef7d8019-ed21-4cdd-875b-c2501a51c34f"
        },
        "value": [
          1695758145.68,
          "165"
        ]
      }
    ]
  }
}
B. Using regular HTTP request over HTTPS
Based on what we have explained in section 1.B let’s say we have added an extra charm ca (self-signed-certificates) with the following charms and relations:
$ juju status --relations
Model          Controller  Cloud/Region        Version  SLA          Timestamp
my-juju-model  microk8s    microk8s/localhost  3.1.5    unsupported  17:10:37-03:00

App          Version  Status  Scale  Charm                       Channel  Rev  Address         Exposed  Message
ca                    active      1  self-signed-certificates    edge      36  10.152.183.71   no
prometheus   2.46.0   active      1  prometheus-k8s              edge     149  10.152.183.174  no
pushgateway  1.6.1    active      1  prometheus-pushgateway-k8s             0  10.152.183.191  no

Unit            Workload  Agent  Address     Ports  Message
ca/0*           active    idle   10.1.38.94
prometheus/0*   active    idle   10.1.38.81
pushgateway/0*  active    idle   10.1.38.97

Relation provider              Requirer                       Interface          Type     Message
ca:certificates                prometheus:certificates        tls-certificates   regular
ca:certificates                pushgateway:certificates       tls-certificates   regular
prometheus:prometheus-peers    prometheus:prometheus-peers    prometheus_peers   peer
pushgateway:metrics-endpoint   prometheus:metrics-endpoint    prometheus_scrape  regular
pushgateway:pushgateway-peers  pushgateway:pushgateway-peers  pushgateway_peers  peer
With a simple bash oneliner we are able perform a HTTP request (over HTTPS) to send metrics:
$ echo "maradona_number 10" | curl -k --data-binary @- https://10.1.38.97:9091/metrics/job/my_batch_job
Once prometheus scrapes pushgateway we can check the metric we have sent it is stored by performing a HTTP request to prometheus:
$ curl -sk https://10.1.38.81:9090/api/v1/query\?query="maradona_number" | jq
{
  "status": "success",
  "data": {
    "resultType": "vector",
    "result": [
      {
        "metric": {
          "__name__": "maradona_number",
          "job": "my_batch_job",
          "juju_application": "pushgateway",
          "juju_charm": "prometheus-pushgateway-k8s",
          "juju_model": "my-juju-model",
          "juju_model_uuid": "ef7d8019-ed21-4cdd-875b-c2501a51c34f"
        },
        "value": [
          1695759201.794,
          "10"
        ]
      }
    ]
  }
}