MicroK8s
Platform:
| Channel | Revision | Published | Runs on |
|---|---|---|---|
| latest/edge | 242 | 02 Dec 2024 | |
| latest/edge | 241 | 02 Dec 2024 | |
| latest/edge | 240 | 02 Dec 2024 | |
| latest/edge | 239 | 02 Dec 2024 | |
| latest/edge | 238 | 02 Dec 2024 | |
| latest/edge | 237 | 02 Dec 2024 | |
| legacy/stable | 124 | 17 Aug 2023 | |
| legacy/stable | 121 | 17 Aug 2023 | |
| legacy/edge | 124 | 10 Aug 2023 | |
| legacy/edge | 125 | 10 Aug 2023 | |
| legacy/edge | 123 | 10 Aug 2023 | |
| legacy/edge | 122 | 10 Aug 2023 | |
| legacy/edge | 121 | 10 Aug 2023 | |
| 1.28/stable | 213 | 20 Sep 2023 | |
| 1.28/edge | 218 | 19 Sep 2023 | |
| 1.28/edge | 217 | 19 Sep 2023 | |
| 1.28/edge | 216 | 19 Sep 2023 | |
| 1.28/edge | 215 | 19 Sep 2023 | |
| 1.28/edge | 213 | 19 Sep 2023 |
juju deploy microk8s --channel edgeThis guide describes how to integrate Charmed MicroK8s with the Canonical Observability Stack(COS) to gather metrics, logs, alerts and display dashboards for the MicroK8s cluster.
Requirements
- A running Charmed MicroK8s cluster
If you are planning to deploy COS on the cluster itself, then you also need to follow the “Deploy Kubernetes charms” guide to configure the MicroK8s cluster as a Juju cloud. For this guide, we will assume that this has already been done and the Juju cloud is named microk8s-cloud.
Deploy COS
NOTE: If you have already deployed COS and only need to integrate it with your MicroK8s cluster, skip to the next section.
First, we create a model and deploy MetalLB. MetalLB will provide a public IP address for Prometheus, Loki and Grafana. Please choose an address that is appropriate for your network, in this example we will use 10.42.42.42.
juju add-model metallb-system microk8s-cloud
juju deploy metallb --channel 1.28/stable --config iprange=10.42.42.42-10.42.42.42
Next, deploy COS using the cos-lite bundle:
juju add-model cos microk8s-cloud
juju deploy cos-lite --channel edge --trust
After cos-lite deployment is complete, the juju status output should look like this. Notice how the traefik application is using the LoadBalancer IP we configured:
Model  Controller  Cloud/Region              Version  SLA          Timestamp
cos    zs          microk8s-cloud/localhost  3.1.5    unsupported  10:19:47+03:00

App           Version  Status  Scale  Charm             Channel  Rev  Address         Exposed  Message
alertmanager  0.25.0   active      1  alertmanager-k8s  edge      88  10.152.183.44   no
catalogue              active      1  catalogue-k8s     edge      25  10.152.183.101  no
grafana       9.2.1    active      1  grafana-k8s       edge      92  10.152.183.245  no
loki          2.7.4    active      1  loki-k8s          edge      97  10.152.183.88   no
prometheus    2.46.0   active      1  prometheus-k8s    edge     148  10.152.183.233  no
traefik       2.10.4   active      1  traefik-k8s       edge     151  10.42.42.42     no

Unit             Workload  Agent  Address       Ports  Message
alertmanager/0*  active    idle   10.1.144.199
catalogue/0*     active    idle   10.1.17.130
grafana/0*       active    idle   10.1.144.200
loki/0*          active    idle   10.1.17.136
prometheus/0*    active    idle   10.1.144.201
traefik/0*       active    idle   10.1.17.135
Our next step is to create offers for the metrics, logs and dashboard endpoints. This will allow us to connect our MicroK8s cluster to COS:
juju offer prometheus:receive-remote-write prometheus
juju offer loki:logging loki
juju offer grafana:grafana-dashboard grafana
Note the endpoint names from the output, e.g.:
Application "prometheus" endpoints [receive-remote-write] available at "admin/cos.prometheus"
Application "loki" endpoints [logging] available at "admin/cos.loki"
Application "grafana" endpoints [grafana-dashboard] available at "admin/cos.grafana"
We will need these names to configure the cross-model relations in the next step.
Integrate MicroK8s with COS
We will now switch back to our main model:
juju switch microk8s
Next, consume the COS endpoints:
juju consume admin/cos.prometheus prometheus
juju consume admin/cos.loki loki
juju consume admin/cos.grafana grafana
Deploy grafana-agent and integrate it with our COS endpoints:
juju deploy grafana-agent --channel edge

juju integrate grafana-agent prometheus
juju integrate grafana-agent loki
juju integrate grafana-agent grafana
As a final step, integrate microk8s with the grafana-agent:
juju integrate microk8s grafana-agent
Wait for everything to settle, the output of juju status should eventually look like this:
Model     Controller  Cloud/Region   Version  SLA          Timestamp
microk8s  zs          zerostack/KHY  3.1.5    unsupported  10:55:27+03:00

SAAS        Status  Store  URL
grafana     active  zs     admin/cos.grafana
loki        active  zs     admin/cos.loki
prometheus  active  zs     admin/cos.prometheus

App            Version  Status  Scale  Charm          Channel      Rev  Exposed  Message
grafana-agent           active      3  grafana-agent  edge          18  no
microk8s       1.28.1   active      3  microk8s       1.28/stable  213  yes      node is ready

Unit                Workload  Agent  Machine  Public address  Ports      Message
microk8s/0          active    idle   0        172.16.100.241  16443/tcp  node is ready
  grafana-agent/0*  active    idle            172.16.100.241
microk8s/1*         active    idle   1        172.16.100.189  16443/tcp  node is ready
  grafana-agent/2   active    idle            172.16.100.189
microk8s/2          active    idle   2        172.16.100.129  16443/tcp  node is ready
  grafana-agent/1   active    idle            172.16.100.129

Machine  State    Address         Inst id                               Base          AZ    Message
0        started  172.16.100.241  9e1e142a-4a5c-407a-9605-6fe0e8abad3c  ubuntu@22.04  nova  ACTIVE
1        started  172.16.100.189  1ad53578-e1e4-42f2-a337-ba4f17f4be38  ubuntu@22.04  nova  ACTIVE
2        started  172.16.100.129  46d9e8fd-a47c-44aa-b43e-1490394f29bc  ubuntu@22.04  nova  ACTIVE
Explore Dashboards
Retrieve the Grafana admin password
JUJU_MODEL=cos juju run grafana/leader get-admin-password --wait
The output should include the admin password, as well as the URL where you can access Grafana:
admin-password: x6a798da56as321
url: http://10.42.42.42/cos-grafana
After logging in to Grafana, go to the list of Dashboards, and you can see a number of provisioned dashboards for the MicroK8s cluster:
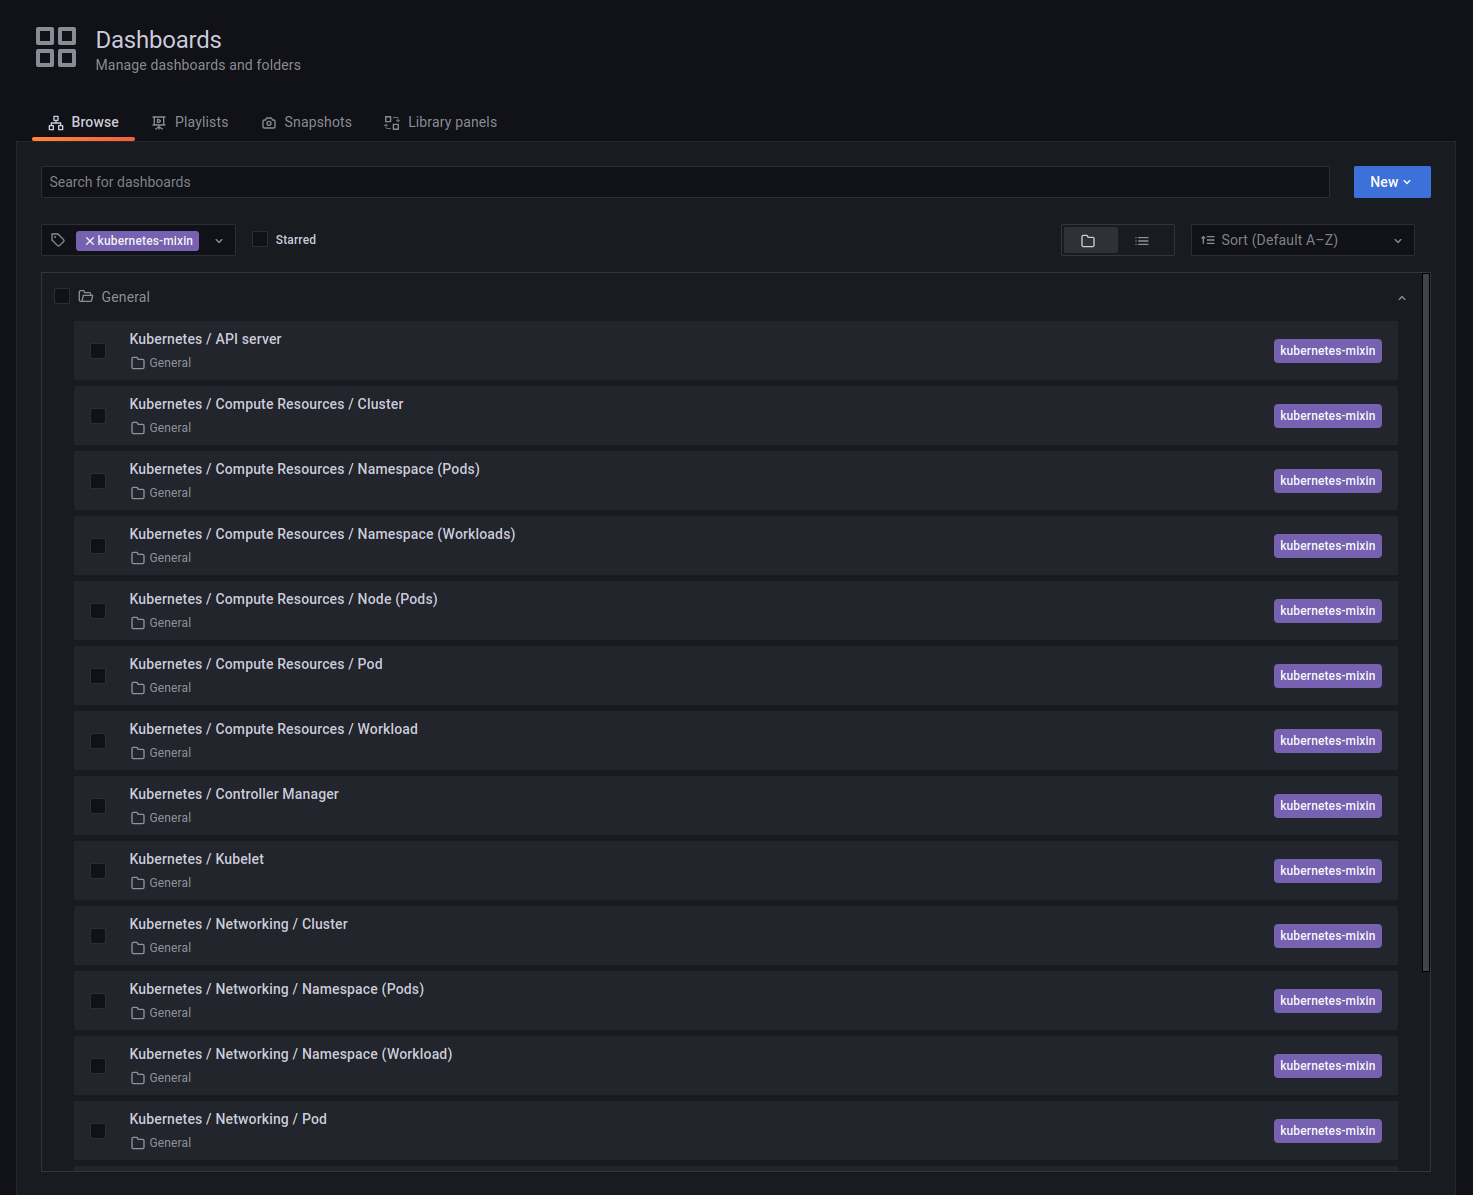
Node Monitoring
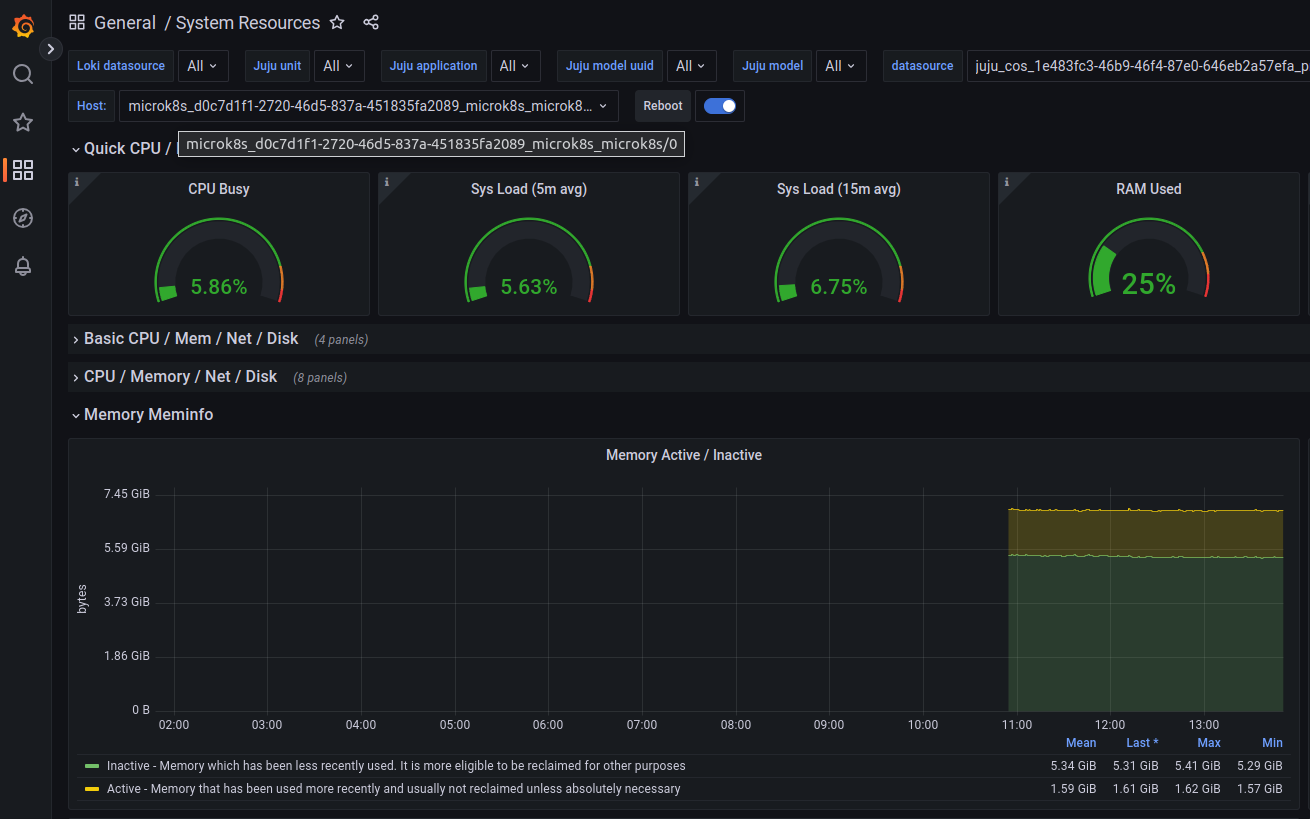
Use the General / System Resources dashboard to see metrics and graphs for the individual MicroK8s nodes:
An example view can be seen below:
Control Plane Services
The following dashboards can be used to monitor the respective control plane services of the MicroK8s cluster:
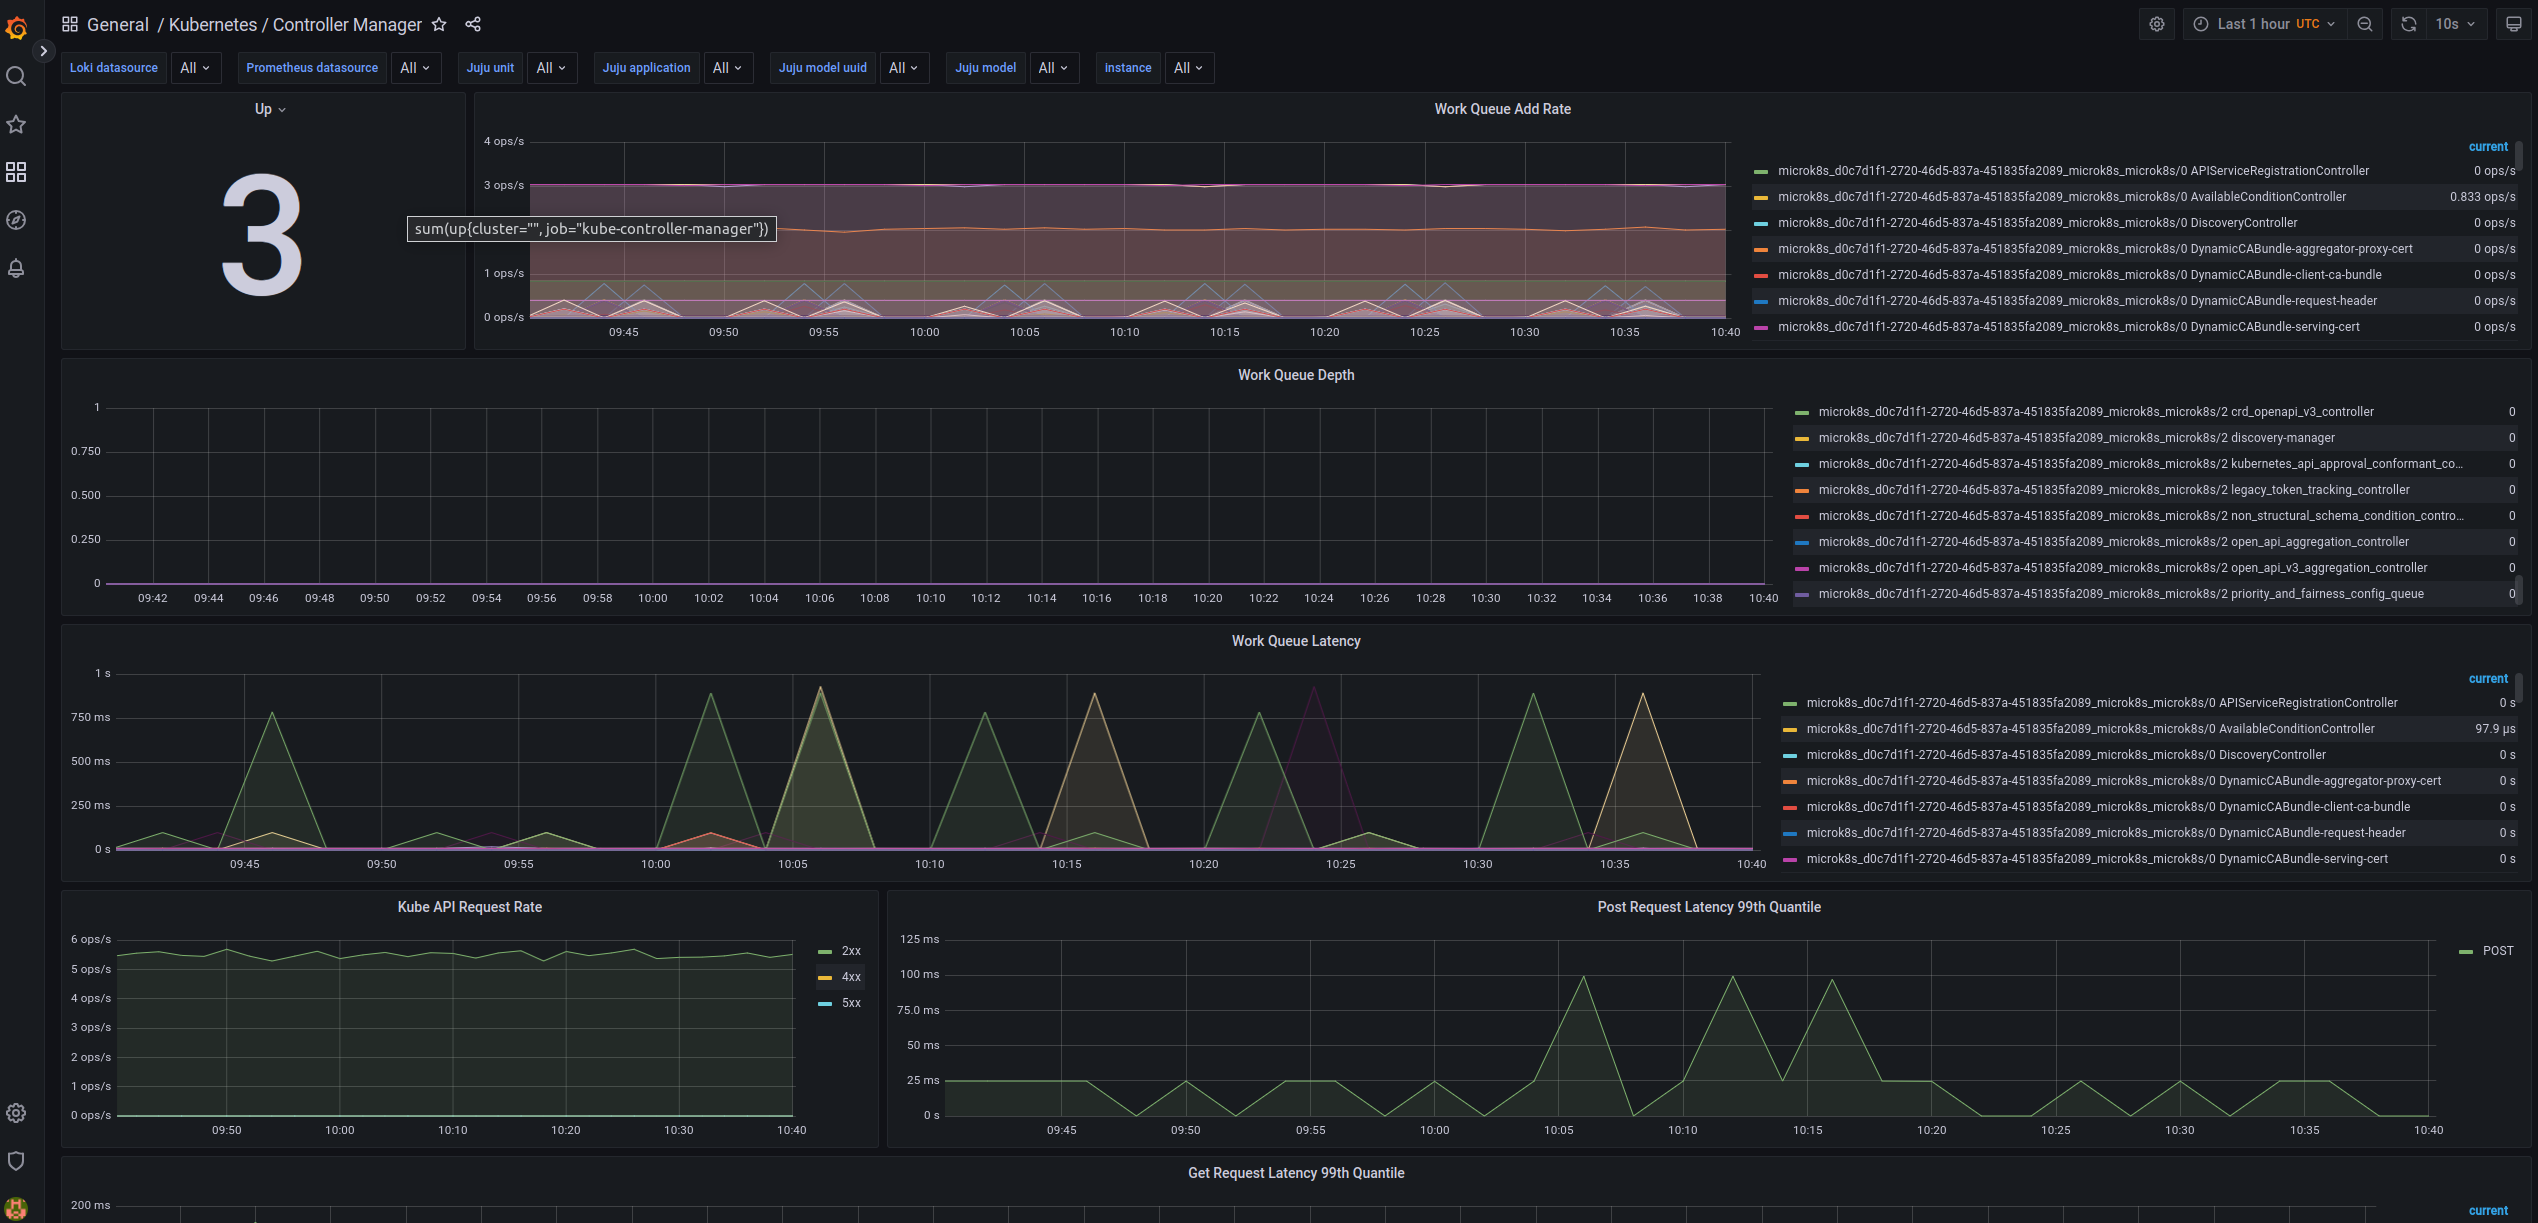
Kubernetes / API ServerKubernetes / KubeletKubernetes / ProxyKubernetes / SchedulerKubernetes / Controller Manager
An example view of the Kubernetes / Controller Manager dashboard can be seen below:
Workload monitoring
The following dashboards can be used to monitor the status and compute usage of workloads running in the MicroK8s cluster:
Kubernetes / Compute Resources / ClusterKubernetes / Compute Resources / Namespace (Pods)Kubernetes / Compute Resources / Namespace (Workloads)Kubernetes / Compute Resources / Node (Pods)Kubernetes / Compute Resources / PodKubernetes / Compute Resources / Workload
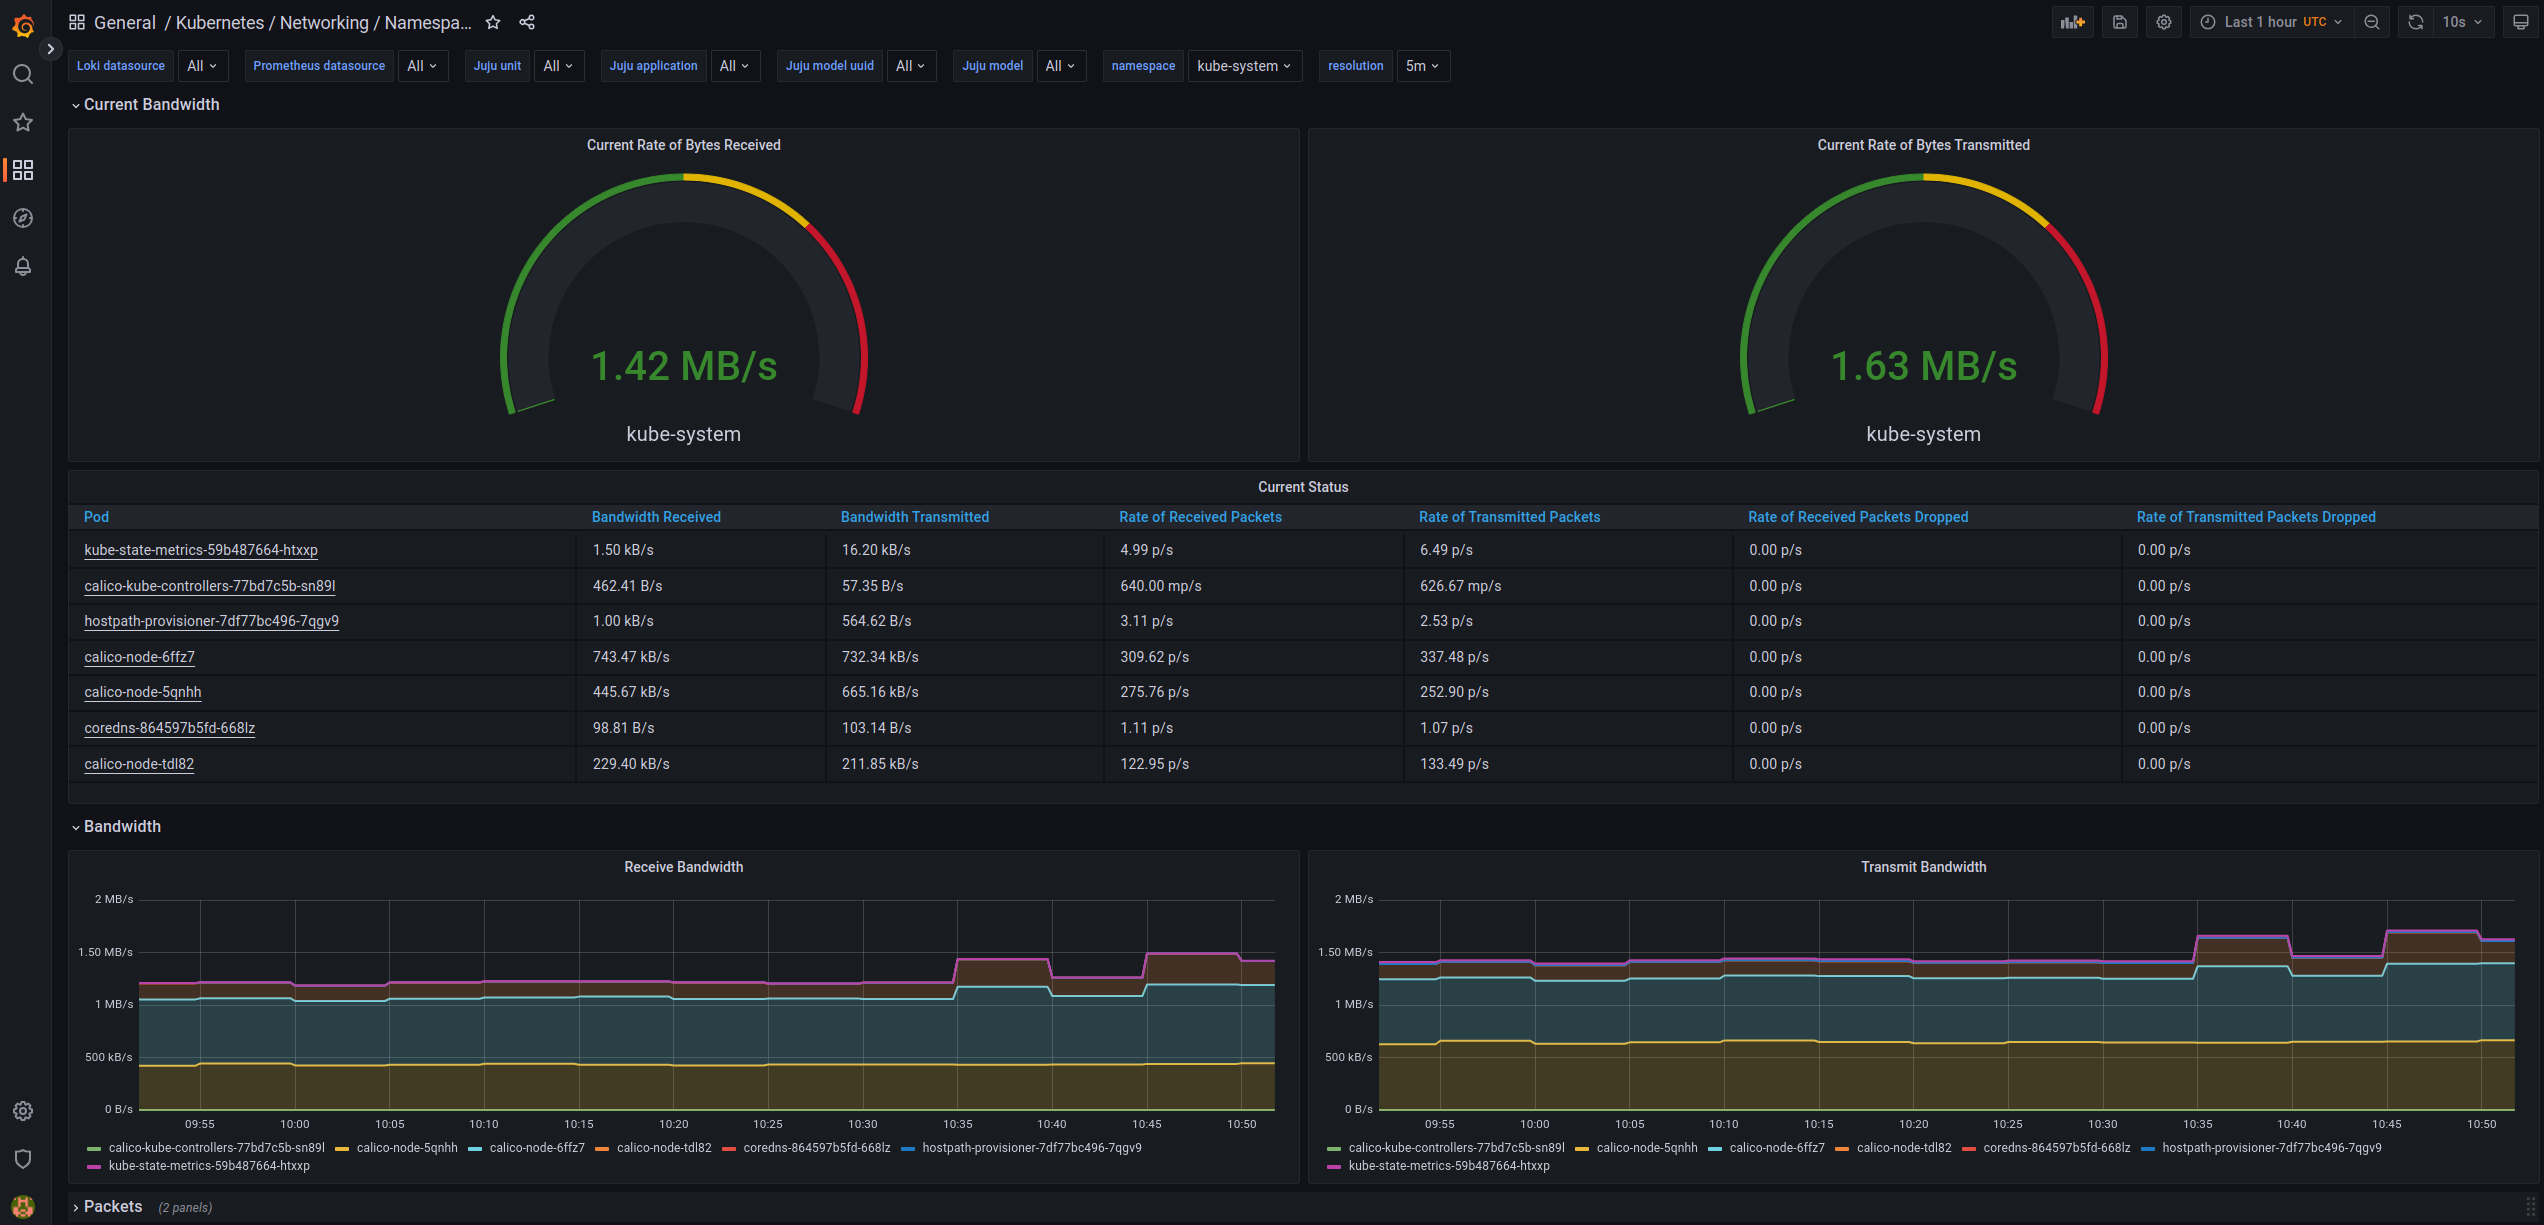
The following dashboards can be used to monitor the networking traffic in the MicroK8s cluster:
Kubernetes / Networking / ClusterKubernetes / Networking / Namespace (Pods)Kubernetes / Networking / Namespace (Workloads)Kubernetes / Networking / PodKubernetes / Networking / Workload
The following dashboards can be used to monitor the status of PersistentVolumes in the MicroK8s cluster:
Kubernetes / Persistent Volumes
An example view of the Kubernetes / Networking / Namespace (Pods) dashboard can be seen below: