
Grafana
- Canonical Observability
| Channel | Revision | Published | Runs on |
|---|---|---|---|
| latest/stable | 139 | 01 Apr 2025 | |
| latest/candidate | 143 | 01 Apr 2025 | |
| latest/beta | 143 | 18 Mar 2025 | |
| latest/edge | 145 | 07 Apr 2025 | |
| 1.0/stable | 93 | 12 Dec 2023 | |
| 1.0/candidate | 93 | 22 Nov 2023 | |
| 1.0/beta | 93 | 22 Nov 2023 | |
| 1.0/edge | 93 | 22 Nov 2023 |
juju deploy grafana-k8s --channel candidate
Deploy Kubernetes operators easily with Juju, the Universal Operator Lifecycle Manager. Need a Kubernetes cluster? Install MicroK8s to create a full CNCF-certified Kubernetes system in under 60 seconds.
Platform:
With grafana, we can visually display a subset of our metrics and logs, using dashboards and panels. To a large degree this is a matter of experience and taste. The purpose of this document is to outline best practices for creating Grafana dashboards that look, feel, and behave in a consistent way across all charms and projects that integrate with the Canonical Observability Stack.
Charmed dashboards are packed together with their target charm, and are automatically listed in grafana once related to grafana. For this reason, the target audience of dashboards is e.g. an on-caller you have never met.
Principles
A dashboard should tell a story or answer a question
Every dashboard panel should add insight to the question posed by the dashboard’s title.
A dashboard should have a clear goal and purpose. If you cannot concisely formulate your dashboard’s reason for existence, it is very likely that it’s not serving a purpose for anyone. As a side note: It’s convenient is not a valid goal.
A dashboard should reduce the cognitive load, not add to it
A newly created dashboard makes sense to the author, but it should also make sense to the author a year from creating the dashboard, as well as to new eyes.
A dashboard should be tailored to the audience looking at it
Who is the primary audience of your dashboard? Depending on who you’re targeting, your dashboard is likely going to look very different. Trying to cater to all of these personas in a single dashboard is most likely going to result in a dashboard that does not provide any value to either. Instead of combining multiple purposes into a single dashboard, consider splitting it into multiple linked dashboards.
Some examples of common dashboard personas:
The Site Reliability Engineer
Looking to surface, pinpoint, and analyze a problem that is occurring in a production environment. This persona likely has a high level of general technical understanding but not necessarily about the inner workings of the system being observed. Not likely to be interested in the commercial consequences of the problem.
The System Administrator
Similar to the Site Reliability Engineer in purpose and technical aptitude, but likely to be more focused on the inner workings of the system than the infrastructure it is running on.
The Customer
Wants to know whether there is a problem and whether the system is still within the boundaries of the commercial service level agreements. Likely not too interested in the technical details but in the commercial consequences of the problem.
The charm author
Wants to know:
- Does a different workload version have a considerable impact on resource utilization?
- Does a particular opinionated config change have an impact on performance?
Actionable advice
Use a top-down approach
Go from general to specific. Should be applied both globally and per row. What is most interesting or useful for the intended audience? Keep that as far up as possible in your dashboard.
Use explanations liberally
As someone building a dashboard, it’s easy to walk into the trap of thinking that what’s being visualized will be as obvious to the user as it is to you. Unless you are the only one who will ever use the dashboard, this is almost entirely certain to not be the case.
For “power users” that already have the context, instructions and explanations can be easily discarded while looking at the dashboard. For new users, it will be paramount for their understanding.
Don’t hide vital information in links, or tooltips that require hovering to be revealed.
Use rows to group information
- Separate dashboards for the host system and the application.
- Separate rows for cpu, storage, network, etc.
Use clear time series labels
Make sure that each time series label is as unambiguous as possible by including just the right amount of information to make it stand out as unique and descriptive.
Use the right visualization for the right metric
HTTP status codes

A good way to display HTTP status codes visually can be the State Timeline plugin, which allows to immediately grasp possibly time-related network issues.
Data rates

Time Series visualizations are generally effective for data rates
-
Using aggregations like min, max, avg, and mean can be very useful.
-
Sometimes it makes sense to set log-scale for the y axis.
-
Sometimes, you might be interested in how fast the data rate is increasing/decreasing instead of the actual rate: in that case, it would make sense to use a derivative in the expression.
API request latency
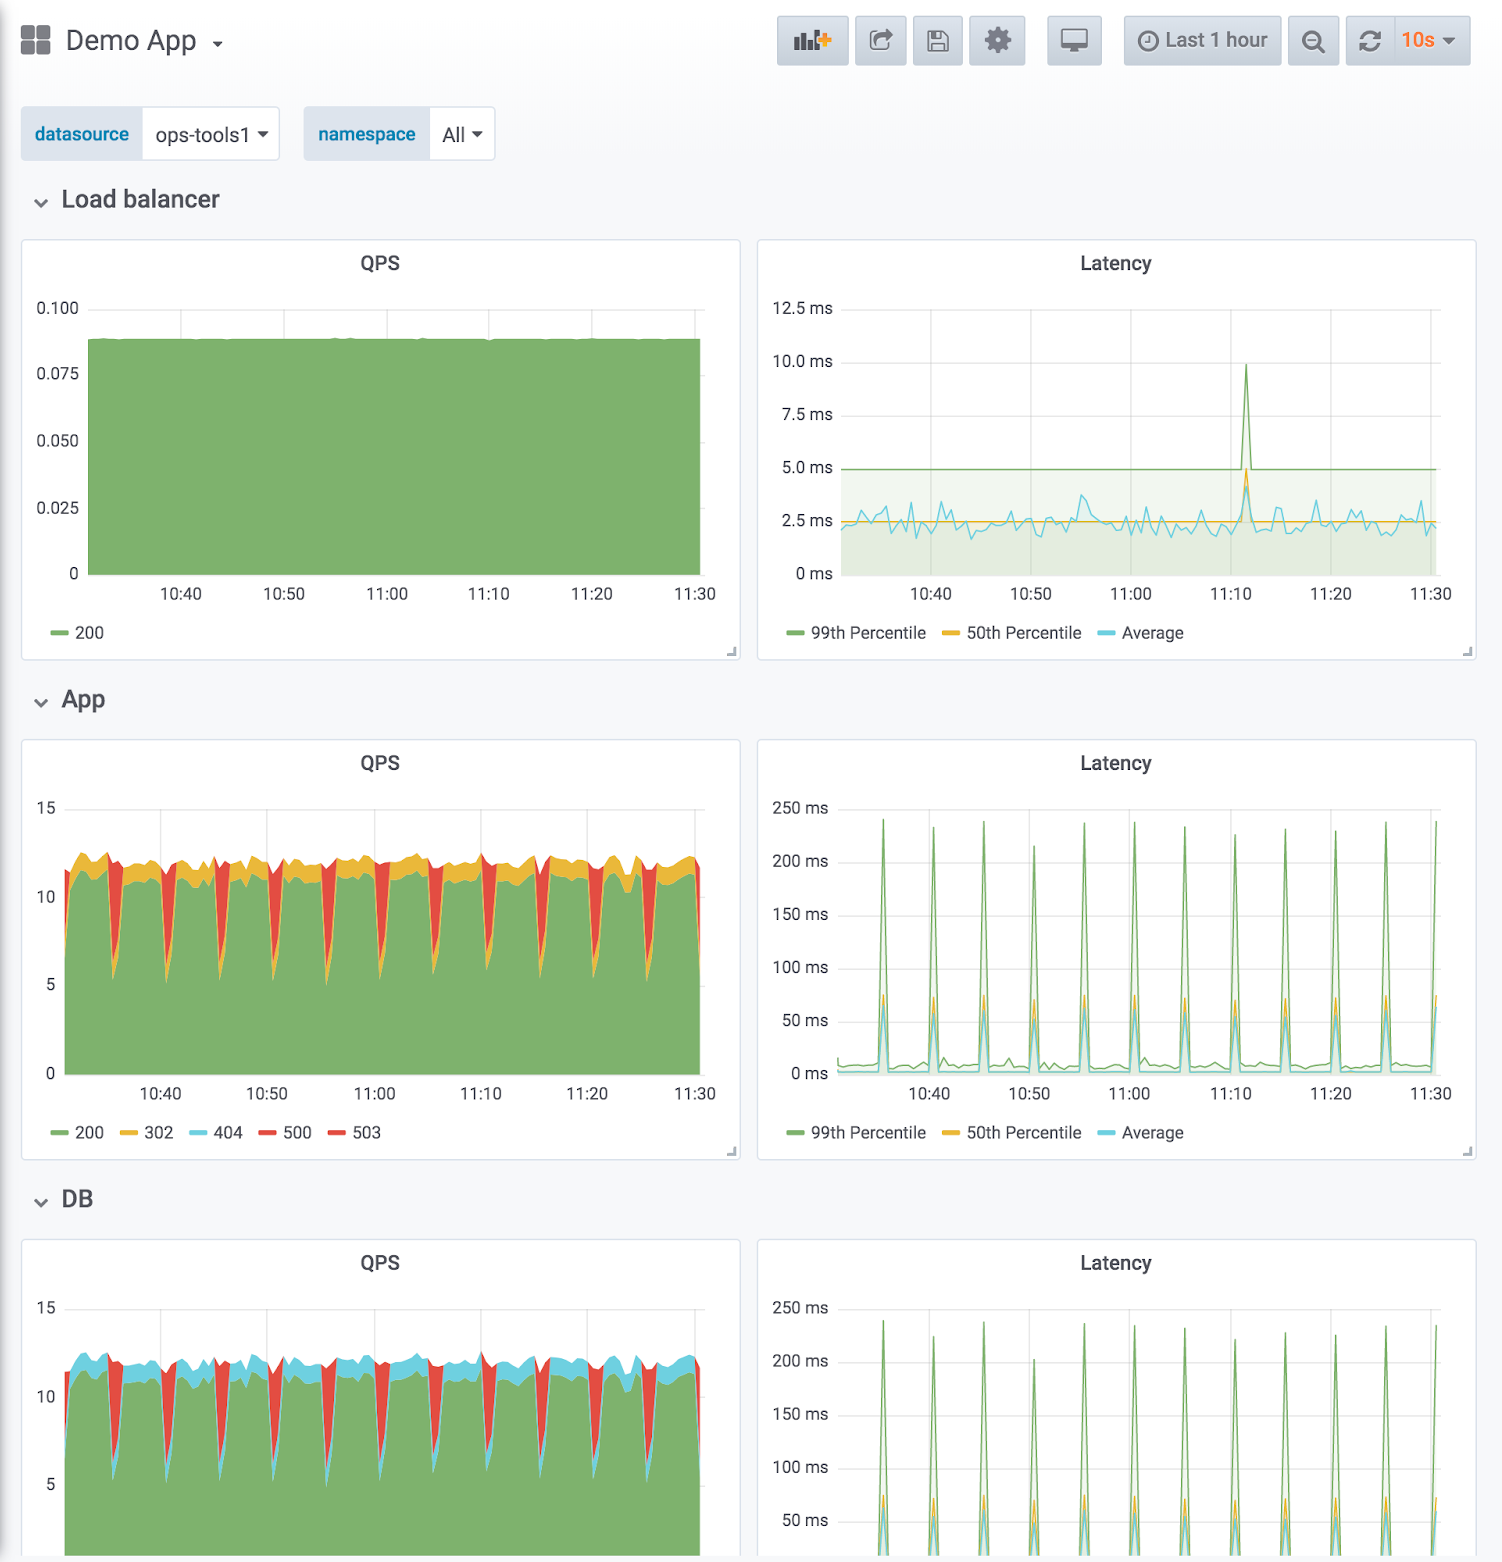 (image from the Grafana dashboard best practices)
For latency, it’s often more interesting to visualize aggregated data: specifically, quantiles are extremely flexible and allow you to better contextualize latency issues:
- the 99th Percentile indicates what latency most requests fall under; it’s useful to cut off uninteresting spikes;
- the 50th Percentile is the median latency, useful as a more robust indicator of the average latency of a request.
Different quantiles are useful for different use cases (10th Percentile, 90th Percentile and 95th Percentile are also commonly used).
Most common error types
- Accumulated, reverse-sorted.

Address SLOs
Refs:
- https://www.oreilly.com/library/view/implementing-service-level/9781492076803/
- GitHub - slok/sloth: 🦥 Easy and simple Prometheus SLO (service level objectives) generator
Provide ways to dig deeper
If there is another dashboard that allows the user to have a deeper look into the issue, provide a link to it. If there is a helper query that can help in getting more information that doesn’t fit well into an overview provided with a dashboard, add a link to the query.
Example: a service overview might show a panel with cache status that could link to a separate cache dashboard with more metrics.
Combine different telemetry types
Dashboards don’t have to be only about the metrics. In cases when the user has access to more than one telemetry type (metrics, logs, traces) often it makes sense to combine them together in a single dashboard. An example could be “recent longest queries” showing the longest running traces from the dashboard timespan. Different telemetry types add different context that can be helpful as long as it fits the same dashboard story.
Use an effective naming scheme
When making your dashboard, you should choose a good name that summarizes its contents.
Dashboards are identified by their UID; it’s a good practice to set it by following the format {charm_name}-{dashboard_codename}-{revision_number} (staying within the 40 characters limit). If you make changes to your dashboard, you should always change the title and UID as well, to avoid collisions with previous versions.
Checklist for dashboard composition
- Manually review all the metrics the workload exposes and decide which could be used to reflect potential failure modes. Use them for panels.
- The dashboard and all panels have an intro text box explaining why the dashboard/panel is important, and what to look for. Top row has introduction/declaration of purpose.
Checklist for template variables
- Use query variables in variables so that dropdowns are automatically populated by grafana. For example, “label values” extracts all the values a given label has. This approach is likely better than a free-text regex match.
- Ideally (but not necessary), all dropdowns should be applicable to all panels in the dashboard. It may be confusing if changes in dropdown selection do not affect some panels.
Checklist for panel design
- Both X and Y axis have labels.
- Standard panels are used for:
- HTTP status codes and endpoint latency.
- 50, 95 and 99 percentiles.
- Panel legend is dynamic and aggregated correctly (e.g. using aggregation operators
by,without). Keep in mind multi-app multi-unit deployments. - Panel threshold for green/red is correctly set (or disabled).
Example production grade grafana instances
References
- Grafana Dashboard Best Practices
- Grafana dashboards: A complete guide to all the different types you can build
- Google SRE Book

%27%20fill%3D%27%23E95420%27%3E%3Cpath%20d%3D%27m15.839%205.293-1.447-2.8a.136.136%200%200%200-.051-.055.144.144%200%200%200-.074-.02h-5.8a.143.143%200%200%200-.091.03.13.13%200%200%200-.034.17.138.138%200%200%200%20.072.06l7.251%202.8a.144.144%200%200%200%20.17-.054.13.13%200%200%200%20.007-.13l-.003-.001ZM11.839%204.945.073.223A.073.073%200%200%200%20.026.221a.07.07%200%200%200-.038.027.065.065%200%200%200%20.007.086l7.962%208.182a.069.069%200%200%200%20.049.022.072.072%200%200%200%20.047-.019l3.805-3.461a.066.066%200%200%200%20.02-.061.065.065%200%200%200-.014-.03.07.07%200%200%200-.028-.02l.003-.002ZM5.382%207.183a.071.071%200%200%200-.062-.022.07.07%200%200%200-.03.011.067.067%200%200%200-.023.025l-4.13%207.696a.065.065%200%200%200-.005.046.068.068%200%200%200%20.027.038.072.072%200%200%200%20.09-.006L7.13%209.18a.066.066%200%200%200%200-.087l-1.75-1.91Z%27%2F%3E%3C%2Fg%3E%3Cdefs%3E%3CclipPath%20id%3D%27a%27%3E%3Cpath%20fill%3D%27%23fff%27%20d%3D%27M0%200h15.83v15.21H0z%27%2F%3E%3C%2FclipPath%3E%3C%2Fdefs%3E%3C%2Fsvg%3E)

%27%20fill%3D%27%23E95420%27%3E%3Cpath%20d%3D%27M1.936%202.592c.668%200%201.21-.515%201.21-1.151S2.604.29%201.936.29C1.267.29.726.805.726%201.44c0%20.637.541%201.152%201.21%201.152ZM14.56.576H3.404a1.587%201.587%200%200%201%20.024%201.69l-.026.04h11.156a.56.56%200%200%200%20.386-.15.518.518%200%200%200%20.16-.369v-.692a.502.502%200%200%200-.16-.369.543.543%200%200%200-.386-.15ZM1.936%206.701c.668%200%201.21-.515%201.21-1.15%200-.637-.542-1.152-1.21-1.152-.669%200-1.21.515-1.21%201.151s.541%201.151%201.21%201.151ZM14.56%204.685H3.404a1.612%201.612%200%200%201%20.242%201.083c-.03.215-.105.421-.219.608l-.026.04h11.157a.56.56%200%200%200%20.386-.15.518.518%200%200%200%20.16-.37v-.692a.5.5%200%200%200-.16-.369.542.542%200%200%200-.386-.15ZM1.936%2010.81c.668%200%201.21-.515%201.21-1.15%200-.637-.542-1.152-1.21-1.152-.669%200-1.21.515-1.21%201.151s.541%201.151%201.21%201.151ZM14.56%208.795H3.404a1.611%201.611%200%200%201%20.243%201.082%201.581%201.581%200%200%201-.245.648h11.156a.559.559%200%200%200%20.386-.15.517.517%200%200%200%20.16-.37v-.692a.502.502%200%200%200-.16-.368.543.543%200%200%200-.386-.15ZM1.936%2014.92c.668%200%201.21-.515%201.21-1.15%200-.637-.542-1.152-1.21-1.152-.669%200-1.21.515-1.21%201.151s.541%201.151%201.21%201.151ZM14.56%2012.904H3.404a1.611%201.611%200%200%201%20.242%201.082%201.58%201.58%200%200%201-.219.608l-.026.04h11.157a.562.562%200%200%200%20.386-.15.517.517%200%200%200%20.16-.37v-.692a.5.5%200%200%200-.16-.369.543.543%200%200%200-.386-.15Z%27%2F%3E%3C%2Fg%3E%3Cdefs%3E%3CclipPath%20id%3D%27a%27%3E%3Cpath%20fill%3D%27%23fff%27%20d%3D%27M0%200h15.83v15.21H0z%27%2F%3E%3C%2FclipPath%3E%3C%2Fdefs%3E%3C%2Fsvg%3E)
%27%20fill%3D%27%23E95420%27%3E%3Cpath%20d%3D%27M9.618.272c-.634%200-1.243.243-1.691.674-.448.43-.7%201.015-.701%201.624v4.221a1.9%201.9%200%200%201%201.362%200v-4.22a.955.955%200%200%201%20.291-.72%201.067%201.067%200%200%201%201.479%200%20.955.955%200%200%201%20.29.719v.962h1.363V2.57c0-.61-.253-1.194-.702-1.625A2.445%202.445%200%200%200%209.618.272ZM9.017%208.433c0%20.21-.065.417-.187.593a1.102%201.102%200%200%201-.499.393c-.203.08-.426.102-.642.06a1.125%201.125%200%200%201-.568-.292%201.055%201.055%200%200%201-.304-.547%201.028%201.028%200%200%201%20.064-.616c.084-.195.226-.362.41-.479a1.143%201.143%200%200%201%201.401.133c.103.1.185.217.24.347.057.129.085.268.085.408ZM2.773%205.855c-.634.001-1.242.244-1.69.674C.633%206.96.381%207.545.38%208.154v4.082a1.901%201.901%200%200%201%201.363%200V8.154a.955.955%200%200%201%20.29-.719%201.067%201.067%200%200%201%201.479%200%20.955.955%200%200%201%20.29.719v.962h1.363v-.962c0-.61-.253-1.194-.702-1.625a2.444%202.444%200%200%200-1.69-.674ZM2.166%2013.878c0%20.21-.065.415-.186.59-.121.174-.294.31-.496.39-.202.08-.424.102-.638.06a1.119%201.119%200%200%201-.565-.29%201.049%201.049%200%200%201-.302-.543c-.043-.206-.02-.42.063-.614.084-.194.225-.36.407-.476a1.136%201.136%200%200%201%201.394.133%201.024%201.024%200%200%201%20.323.75Z%27%2F%3E%3Cpath%20d%3D%27M14.752%204.76a1.789%201.789%200%200%201-.681-.126v2.411a.972.972%200%200%201-.312.682c-.193.179-.45.28-.718.28-.268%200-.526-.101-.718-.28a.972.972%200%200%201-.312-.682V4.32h-1.363v2.726c0%20.61.252%201.195.7%201.626a2.443%202.443%200%200%200%201.692.673c.635%200%201.244-.242%201.692-.673.449-.431.7-1.016.7-1.626v-2.41a1.9%201.9%200%200%201-.68.125ZM15.858%202.822c.037.225%200%20.455-.107.658a1.1%201.1%200%200%201-.49.472%201.161%201.161%200%200%201-1.302-.198%201.04%201.04%200%200%201-.206-1.251%201.1%201.1%200%200%201%20.492-.47%201.161%201.161%200%200%201%201.299.199c.166.16.276.366.314.59ZM7.907%2010.2c-.233%200-.465-.042-.681-.126V12.6a.97.97%200%200%201-.302.7%201.05%201.05%200%200%201-.728.29%201.05%201.05%200%200%201-.728-.29.97.97%200%200%201-.302-.7V9.845H3.804V12.6c0%20.61.252%201.194.7%201.625a2.443%202.443%200%200%200%201.692.674c.634%200%201.243-.243%201.692-.674.448-.43.7-1.015.7-1.625v-2.526a1.887%201.887%200%200%201-.68.127Z%27%2F%3E%3C%2Fg%3E%3Cdefs%3E%3CclipPath%20id%3D%27a%27%3E%3Cpath%20fill%3D%27%23fff%27%20d%3D%27M0%200h15.83v15.21H0z%27%2F%3E%3C%2FclipPath%3E%3C%2Fdefs%3E%3C%2Fsvg%3E)